From the National Literacy Institute
- 44% of the American adults do not read a book in a year
- 3 out of 4 people on welfare can’t read
- 20% of Americans read below the level needed to earn a living wage
- 50% of the unemployed between the ages of 16 and 21 cannot read well enough to be considered functionally literate
- Approximately 40% of students across the nation cannot read at a basic level.
- 49% of 4th graders eligible for free and reduced-price meals finished below “Basic” on the NAEP reading test.
- Teacher disposition changes drastically during reading instruction with poor readers.
- Student disposition changes when they are made to feel inadequate.
- Students struggle in other academic areas.
- 60% of the behavioral problems occur during reading assignments- group or independently.
From National Center for Education Statistics, July 2019
- Four in five U.S. adults (79 percent) have English literacy skills sufficient to complete tasks that require comparing and contrasting information, paraphrasing, or making low-level inferences
- This translates into 43.0 million U.S. adults who possess low literacy skills: 26.5 million at level 1 and 8.4 million below level 1, while 8.2 million could not participate in PIAAC’s background survey either because of a language barrier or a cognitive or physical inability to be interviewed
- White and Hispanic adults make up the largest percentage of U.S. adults with low levels of English literacy, 35 percent and 34 percent respectively.
- By race/ethnicity and nativity status, the largest percentage of those with low literacy skills are White U.S.-born adults, who represent one third of such low-skilled population. Hispanic adults born outside the United States make up about a quarter of such low-skilled adults in the United States
From ThinkImpact
- 54% of adults have a literacy below 6th grade level.
- Low levels of literacy costs the US up to 2.2 trillion per year.
- The performance gap between certain ethnic groups, such as between White and Black students and between White and Hispanic groups, decreased significantly between 1992 and 2017, though not very much between 2015 and 2017.
From ThinkImpact
- eLearning can help students to retain between 25% and 60% more information.
- However, an increase in eLearning has resulted in a 30% increase of failing grades.
- eLearning has created a socioeconomic divide with 25% to 33% of students not having access to resources.
- 64% of the online learning opportunities were to provide courses not available at a particular school.
- 57% of the opportunities were to help students recover from missed or failed courses.
- 40% of the courses provided students with AP or college-level courses.
- 30% were available to reduce scheduling conflicts.
- In 2019 a total of 57% of all students in the United States were equipped with digital learning tools.
- 45% were elementary students, 64% were middle school students, and 63% were high school students.
- 40% of student device usage was spent on education platforms.
- Full-time classes were available in 68% of high-income districts but only in 36% of schools with low-income students.
- In 2017, 33.5% of higher education students were enrolled in some form of distance or online learning.
- Overall, in 2017, 3.1 million students enrolled exclusively in distance education.
- Over 33% of educators lack support for eLearning.
- 48% of undergrad and grad students felt like online learning was as effective as face-to-face instruction.
- On average, students can retain 25% to 60% more information when learning online compared to 8% to 10% when in the classroom.
- eLearning requires 40% to 60% less time learning than traditional classrooms.
- Completion rates for online courses can be up to 22% lower for some students.
- D and F grades are increasing as much as 30% for some middle school students with online learning.
- In some regions, failing grades for online learning have increased by as much as 70%.
- Students with disabilities have experienced failing grades by around 98%.
- In 2012, 55% of K–12 teachers reported not having enough of computers for students.
- In 2020, 1 in 3 elementary school students will use a mobile device instead of a computer to complete classwork.
- High minority schools were 50% less likely to high speed internet access than low minority schools.
- Low-income schools and rural schools were 50% more likely to have slow internet access.
- 25% of Black households and 23% of Hispanic households don’t have access to high-speed internet.
- Nearly 25% of 15-year olds from disadvantaged backgrounds don’t have access to a computer.
From ThinkImpact
- Summer school has found to be quite instrumental in academic retention and performance.
- Summer school does have a greater positive impact on student’s academic performance than initially expected.
- More than 97% of the top universities offer summer programs for high school and middle school students.
- Just 18% of low-income students will enroll in summer school compared to 29% of non-poor households.
- Continuous enrollment in summer school may improve language capabilities by up to 23%.
- Over 97% of the top universities offer summer programs for high school students and even middle school children.
- The average daily attendance for extended summer courses varies from 60% to 80%.
- 61% of white students are likely to participate in summer learning programs. In contrast, only 18% of Black students, 14% of Hispanic students, 5% of Asian students, and 2% of Native Americans would attend summer school.
From Zippia
- 50.5% of all authors are women, while 49.5% are men.
- The average age of an employed author is 42 years old.
- The most common ethnicity of authors is White (75.6%), followed by Hispanic or Latino (7.6%), Black or African American (5.9%) and Unknown (5.6%).
- 16% of all authors are LGBT.
From Lee & Low Books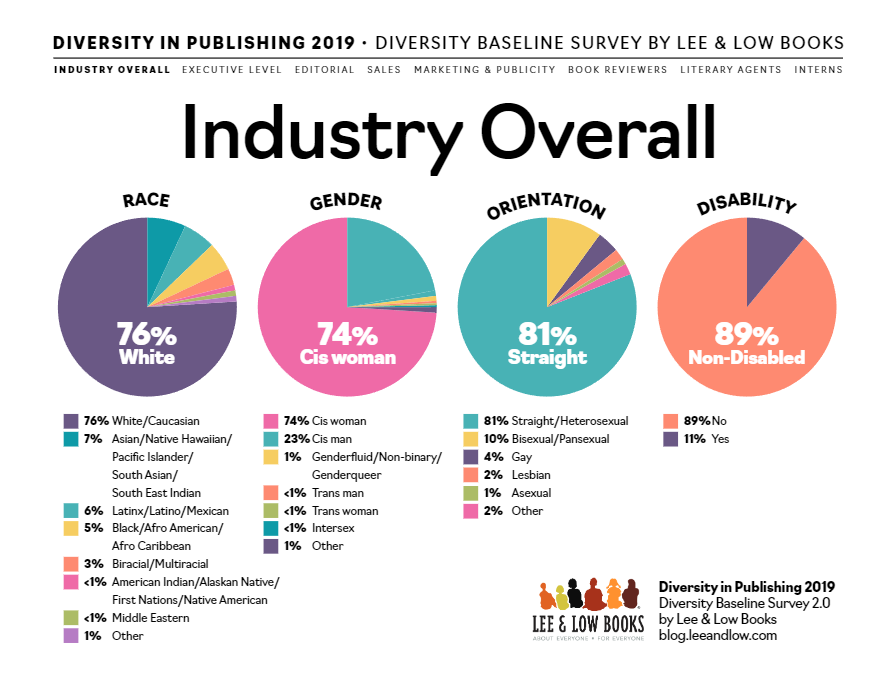 Credit to Lee & Low Books